How Cloud Infrastructure Visualization Helps Cloud Consultants?

by Valts Ausmanis · March 5, 2024
I have worked for more than a decade now as cloud consultant and one thing I know for sure - efficiency in our work is the key. To be more specific - we as cloud consultants have to be top of our game in order to show to our customers that their money on hiring us is valuable investment for their business. Customers want to see real outcome like money (saved) and success when they consume our services. That’s why using tools that facilitate this are super important in our daily work. As our entire job is tightly coupled with customer cloud infrastructures, being able to quickly visualize existing cloud infrastructure is a must-have. Luckily, we have tools that can do this time-consuming work automatically for us!
In This Article
- What Is Cloud Infrastructure?
- Cloud Infrastructure Visualization
- Why Automated Cloud Infrastructure Visualization is Important for Cloud Consultants?
- Summary
What Is Cloud Infrastructure?
In simple words cloud infrastructure represents group of different components like servers, networking resources, storage, databases, managed cloud services to make cloud computing possible. We then use cloud infrastructure to run our cloud services like SaaS applications, APIs, internal services, public websites etc.
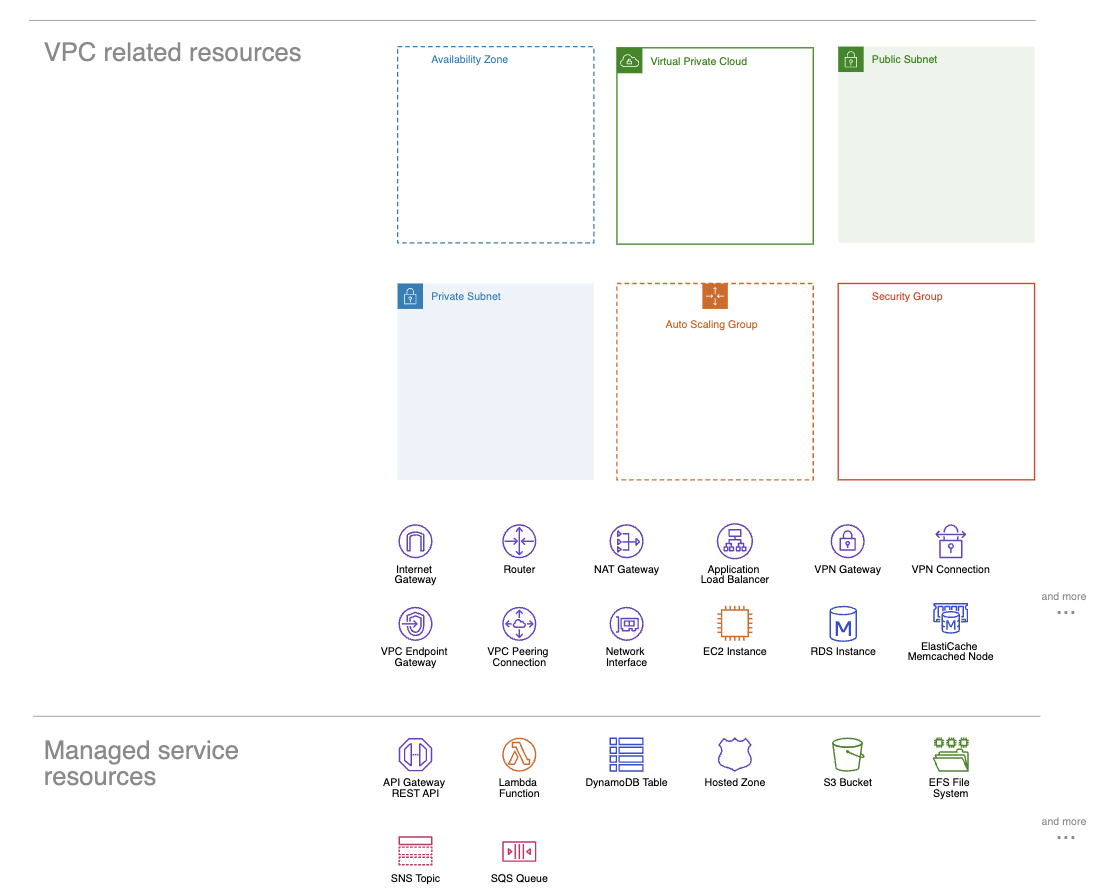
You can group these cloud infrastructure resources in two groups:
- VPC (Virtual Private Cloud) related resources. These are building blocks to define your virtual private cloud which gives you more flexibility and security options to run your cloud services and resembles a traditional network that you would operate in your own data center (ex. VPC, public / private subnet, availability zone, router, NAT gateway, application load balancer etc.)
- Managed service resources. These cloud services work similarly as SaaS applications. You don’t manage underlying cloud infrastructure to run these services but just directly use all the business benefits that these services provide (ex. Lambda function, API Gateway, DynamoDB, SQS, S3 etc.). Most of these services are called as serverless services too.
Cloud Infrastructure Visualization
For each public cloud like AWS, Azure, GCP there is specific icon set that should be used to visualize cloud infrastructures. These icons are representing different cloud services and resources that put together visualize specific cloud infrastructure. In our case we use AWS cloud and their official icon set for AWS infrastructure visualization.
There are several cloud architecture diagramming tools like Draw.io / Diagrams.net, Visio, Lucidchart, Cloudviz.io etc. where these icon sets are pre-built and ready to be used to visualize your cloud infrastructure.
I must say that I have used all of these diagramming tools mentioned above and the most flexible and free to use tool to visualize AWS infrastructure from the scratch is definitely Draw.io / Diagrams.net. There are many existing integrations with other tools like Confluence, Jira etc. that make it a great tool to diagram and later share your cloud infrastructure with you team.
Why Automated Cloud Infrastructure Visualization is Important for Cloud Consultants?
In the previous section, I talked about cloud infrastructure visualization and the manual creation of diagrams from scratch. However, with cloud infrastructure changing frequently nowadays, it consumes a lot of time to manually update it after every change.
Luckily, there are tools that let you automatically visualize your cloud infrastructure like Cloudviz.io, Cloudcraft, Hava, Cloudockit etc. Let's take a closer look at how automated cloud infrastructure visualization helps cloud consultants to become more successful and keeps their clients satisfied.
Simplify new customer on-boarding

Regardless of whether you're working as a freelance cloud consultant or in a cloud consulting company, onboarding new clients as quickly as possible and starting to produce valuable outcomes from your work is really important. As mentioned previously customers want to see real outcome like money (saved) and success when they consume our services.
By using automated cloud infrastructure visualization during the new client onboarding, we can create detailed and accurate cloud documentation of your client’s cloud environments and see the nice overview of what’s running where. Automated cloud documentation gives cloud consultants with “live” details about what is currently deployed in customers cloud environments so it’s possible to immediately start to work on requested infrastructure changes and improvements.
In order to auto generate cloud infrastructure documentation with Cloudviz.io tool:
- Connect your clients AWS account to Cloudviz.io.
- Choose specific region and initiate sync.
- Generate technical documentation for your AWS account and region.
Clearer communication through visual diagrams

There are two types of cloud consultants:
- The ones that love to create cloud infrastructure diagrams and dive into details to provide best possible visual representation of client’s cloud architecture. But deep inside they know they are spending way too much time on this task.
- The ones that are pushing themselves really hard to create cloud infrastructure visualization that “works”. At the end they know they could do this better.
In both scenarios automated cloud infrastructure visualization would save a lot of time (and “pain”) for cloud consultants to represent their work of new or existing cloud architecture updates to their customers.
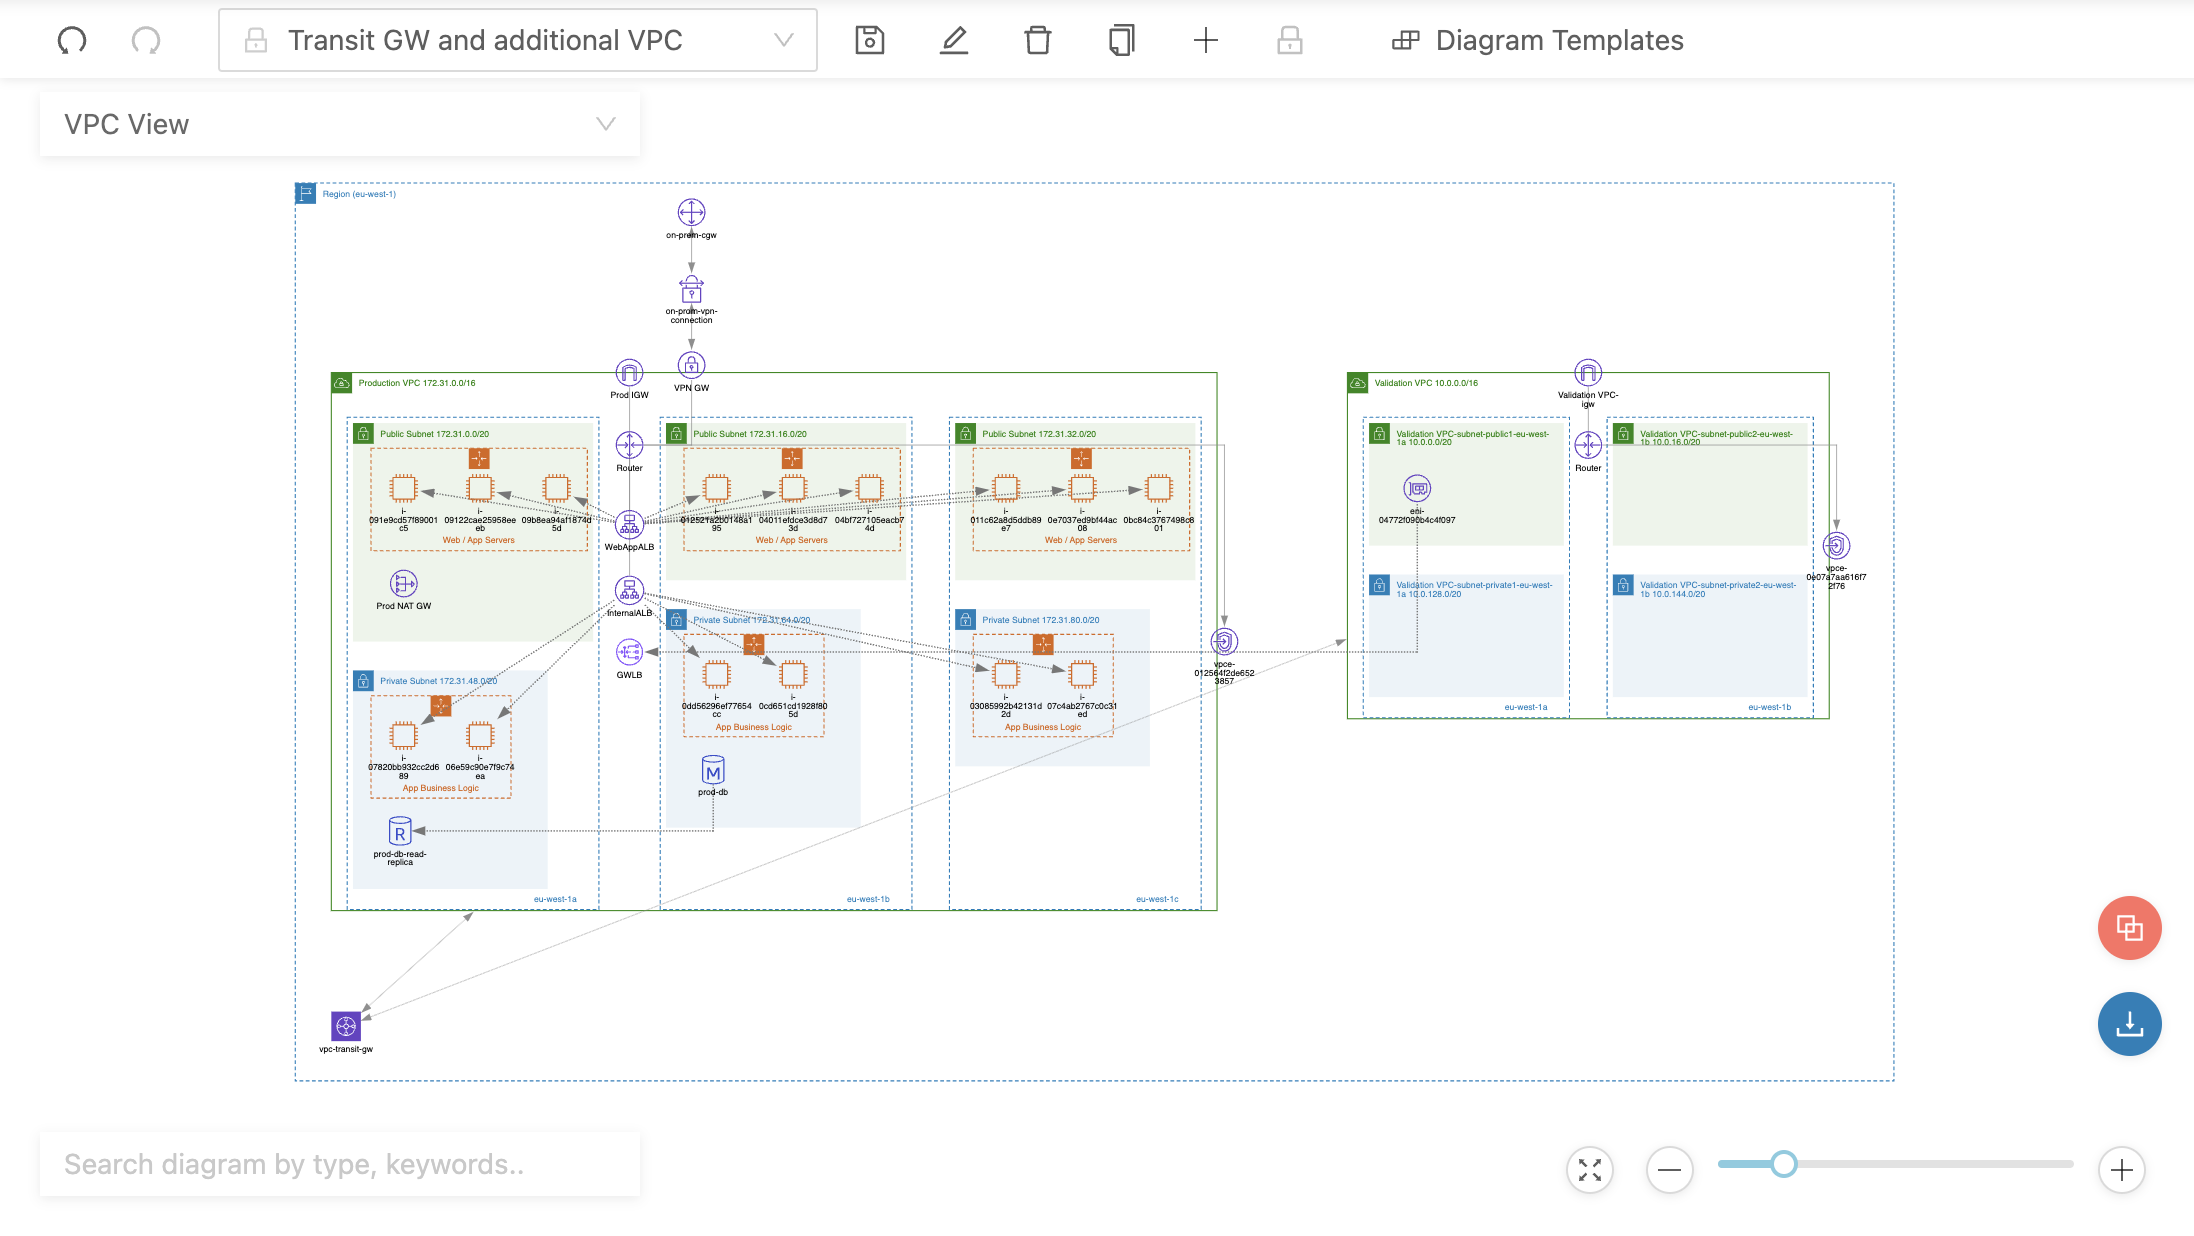
For example, imagine your client has complex VPC architecture with many EC2 instances, load balancers, VPC endpoints, VPN connections, transit gateways etc. In order to understand and visualize how each of the resources connect to each other by using AWS console would take a lot of time. But by using tools like Cloudviz.io it's possible to automatically generate clean cloud architecture diagram and update it with changes necessary for your client.
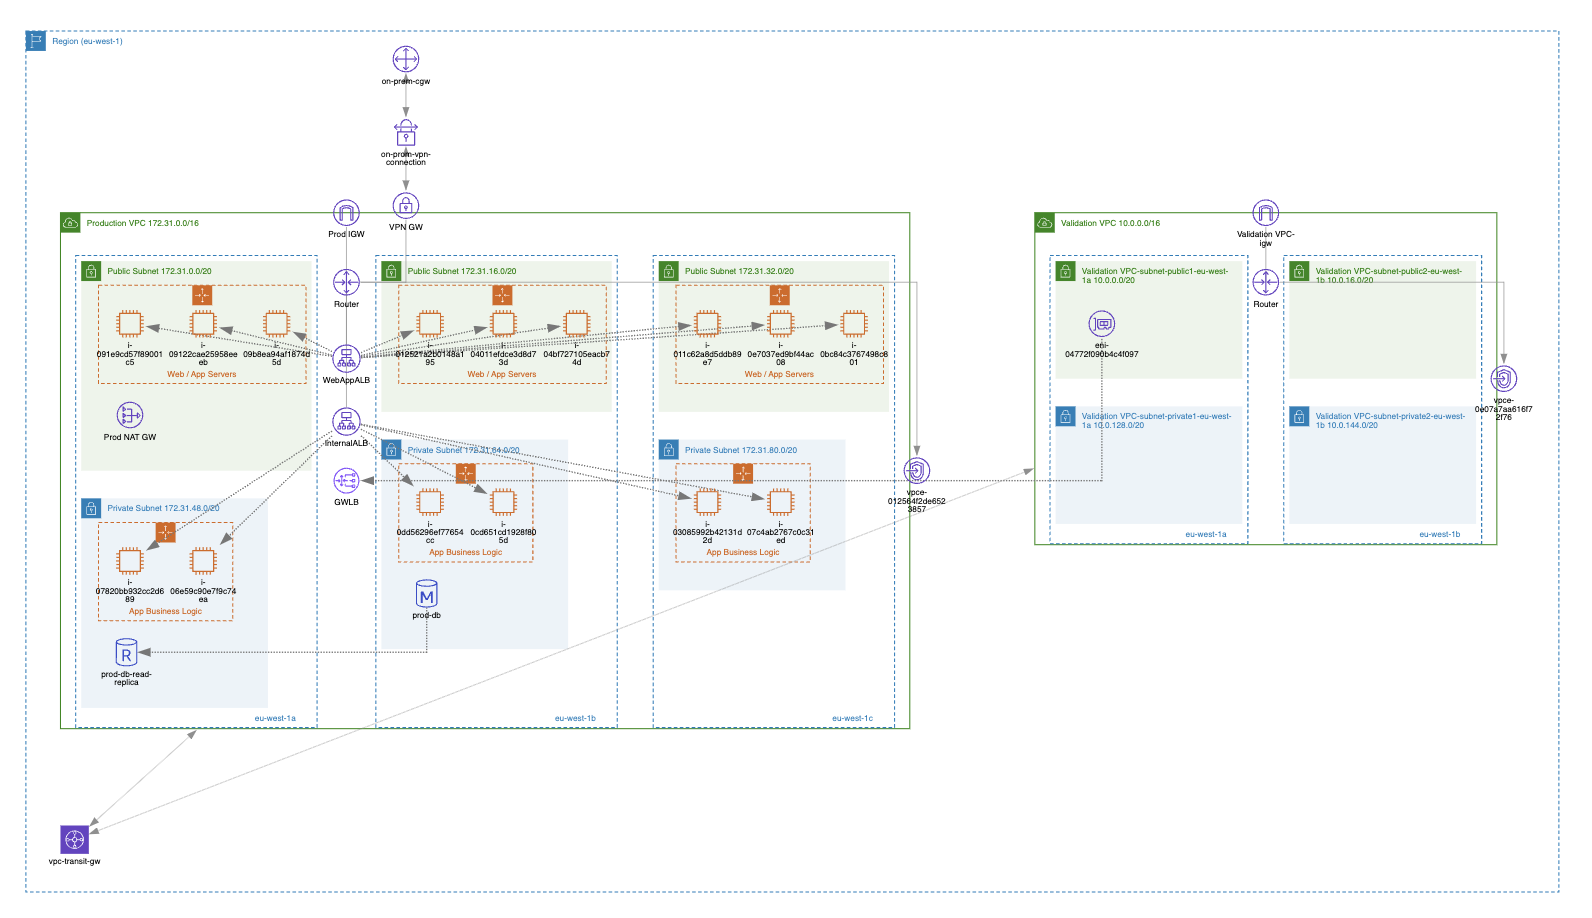
It’s possible to export generated diagrams to Draw.io / Diagrams.net tool and continue to work there.
Be proactive and identify potential risks

To be successful cloud consultant you have to be proactive and sometimes do more than it’s actually asked from you. By doing that and providing valuable insights you earn trust from your customers. Automated infrastructure visualization helps you to identify potential risks and issues related with customer cloud environments.
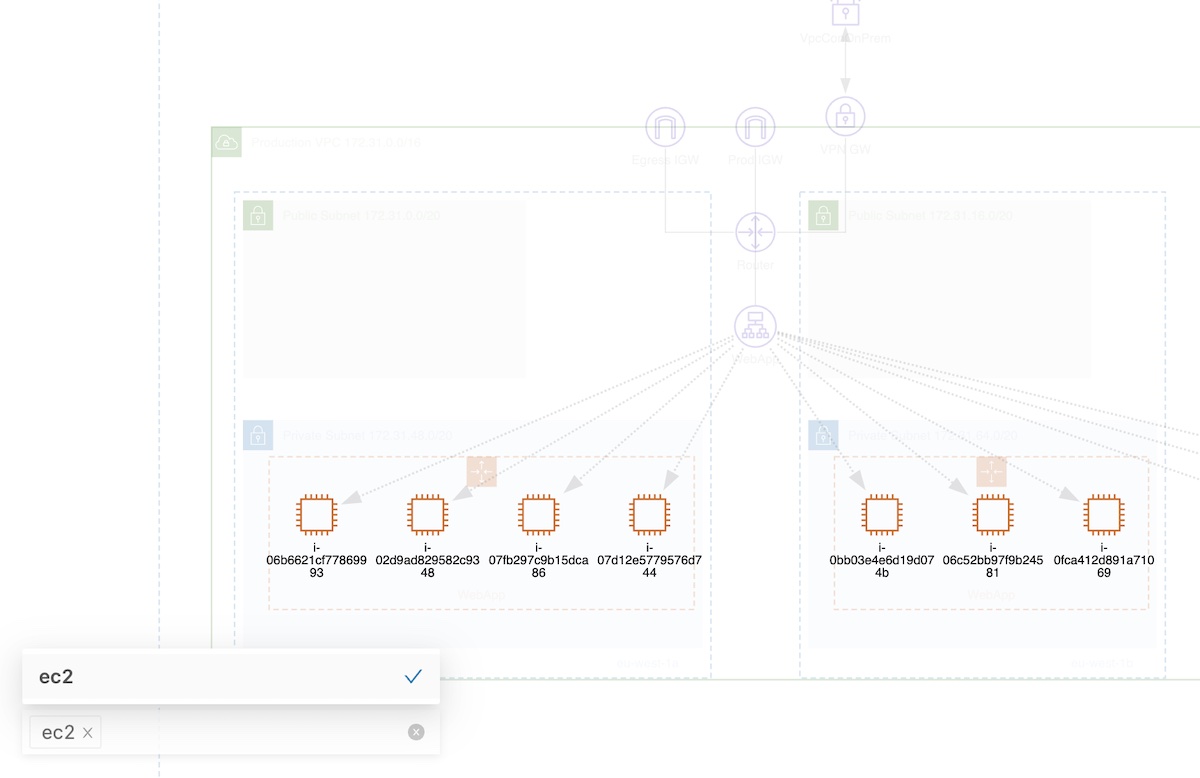
For example, your customer has solid cluster of running large EC2 instances in autoscaling group to support Kubernetes cluster with worker nodes. There was a high traffic usage peak for one hour which resulted in many additional running EC2 instances. After few days additional instances are still running (due to some autoscaling issue on AWS side). By using automated network infrastructure visualization cloud consultants would be able to easier identify any redundant resource that costs extra money for their clients. It’s not a secret that visually we perceive and analyze information much better comparing to text data.
Improve customer interaction and keep them happy

We have to interact and follow up with our customers even when there isn’t much to “show” yet. By using automatically generated cloud documentation we can share this with our customers not only after we have made some infrastructure changes but we can share this documentation on weekly basis too. Thus, clients could gain insights into their actual cloud setups, fostering trust and collaboration.
Use your own branding

By using your logo, colors, and distinctive elements, in generated documentation is a powerful strategy that reinforces your professional image, strengthens your identity, and maintains consistency across the documents you deliver to your clients. For example, if you are cloud consulting agency you can use your own logo and brand colors or you can deliver cloud documentation using clients branding elements.
Cloudviz.io tool allows to create your own documentation template and use it when generating cloud documentation for your clients.
Summary
In my first years working as a cloud consultant visualization of customers’ existing cloud infrastructure took some time to finish and, in many scenarios, it wasn’t 100% accurate too. Not because I couldn’t work on details but because it was challenging to get all the connections right. Still that cloud infrastructure diagram was useful but every time we made a larger infrastructure change diagram needed to be re-designed. And I will be honest to you – many times we forgot to update it. This led to situation that nobody from the team really relied on that diagram and to get “as is” overview we anyway went to AWS console to put the “live” pieces together.
After some time, I understood that this shouldn’t be like this and there should be simple automated way to visualize actual cloud infrastructure and this was the time when Cloudviz.io was created! Possibility to automatically visualize and document customers’ existing cloud infrastructure was a game changer that improved my and my team’s productivity, customer interaction and quality of our work.
One awesome cloud diagram can say much more than hundreds of lines of text!

As experienced AWS architects and developers, our mission is to provide users an easy way to generate stunning AWS architecture diagrams and detailed technical documentation. Join us to simplify your diagramming process and unleash the beauty of your cloud infrastructure
Support
Contact
Copyright © 2019 - 2026 Cloudviz Solutions SIA